
Explore
Explore is the scratchpad. When you have a question that no dashboard answers — “did the defect rate change after we swapped the feeder?” — this is where you work it out.
The loop
Section titled “The loop”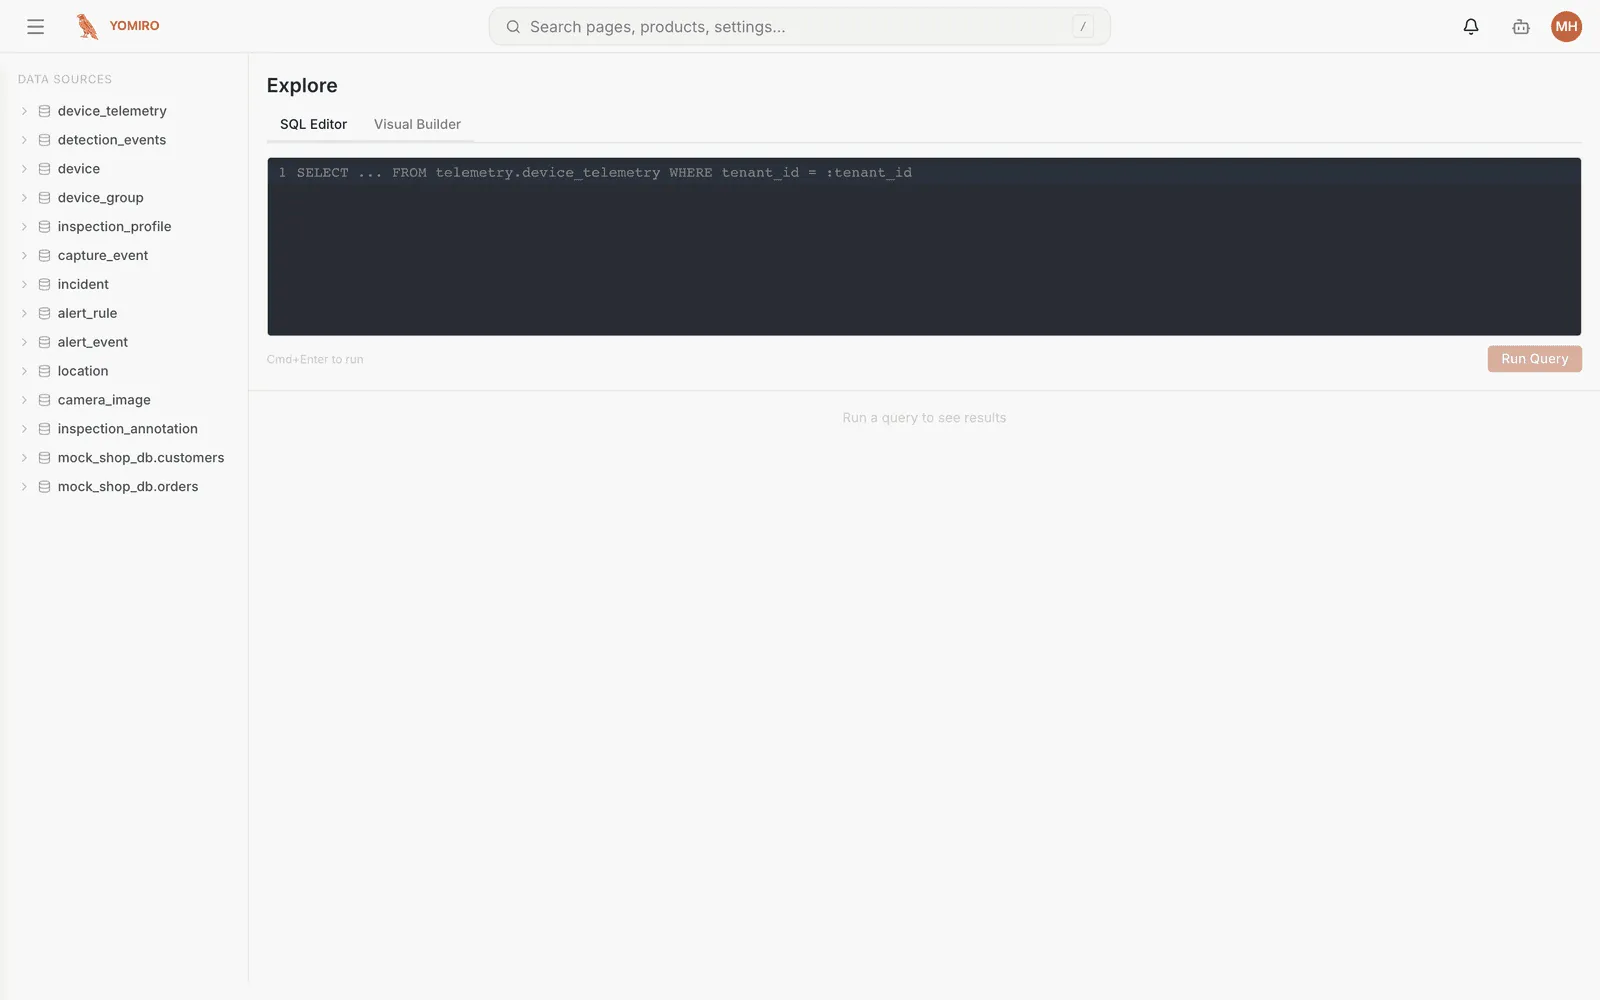
- Write a query against your production data
- Run Query
- Choose how to draw the result
- Keep it, or change the query and run again
Nothing here is saved by default. Explore is for thinking, not for publishing.
Visualisations
Section titled “Visualisations”The same result set can be drawn several ways, and switching is instant:
| Type | Reach for it when |
|---|---|
| Time series | The question is about change over time |
| Bar chart | You are comparing categories |
| Table | You need exact values, not a shape |
| Gauge | It is one number against a target |
| Pie chart | It is composition, with few enough slices to read |
Saving a query to a dashboard
Section titled “Saving a query to a dashboard”Once a query earns its keep, Add to Dashboard turns it into a permanent widget on a Monitoring dashboard. You confirm which dashboard, and the widget is added with the visualisation you chose.
The reverse trip exists too: a widget on a dashboard offers Open in Explore, which drops you back here with that widget’s query loaded. Use it when a dashboard raises a question rather than answering one.
What you can query
Section titled “What you can query”The Data sources panel down the left lists everything available. Out of the box that includes the platform’s own tables:
| Table | Holds |
|---|---|
device_telemetry |
CPU, memory, temperature per device over time |
detection_events |
Every detection the cameras produced |
capture_event |
Saved capture events |
inspection_profile |
Profiles and their revisions |
device / device_group |
Your fleet and its grouping |
location |
The site → area → line → unit tree |
incident |
Incidents and their history |
alert_rule / alert_event |
Rules and what they fired |
camera_image |
Captured stills |
Alongside those sit any data source you have connected, including on-prem databases bridged through the gateway. That is what makes questions joining production data to business data possible — defect rate against the quotation that priced the job.
Asking instead of writing
Section titled “Asking instead of writing”If you would rather not write the query, an agent can. Describing the question in the chat panel is a supported path to the same place — the agent has access to the same data sources you do.
Related
Section titled “Related”- Monitoring — where good queries end up
- Data sources — what is available to query